Validation And Performance
This page keeps two separate validation records:
- the default
128^3half-channel physics validation requested for turbulence realism; - the short
480 x 240 x 240actuator-turbine benchmark used for CPU/GPU performance comparisons.
Default Half-Channel Validation
This page records the physics validation requested for the standard LESGO half-channel case: no turbines, pressure-gradient forcing, rough-wall lower boundary, and periodic horizontal directions. The purpose is not a short deterministic CPU/GPU bitwise check; it is to confirm that the GPU port still produces a physically turbulent channel-flow solution.
Case Setup
| Item | CPU Run | GPU Run |
|---|---|---|
| Grid | 128 x 128 x 128 |
128 x 128 x 128 |
| Active physics | Default dynamic/Lagrangian SGS | Default dynamic/Lagrangian SGS |
| Turbines | Off | Off |
| Runtime | Restarted at 50,000, continued to 100,000 |
Restarted at 50,000, continued to 100,000 |
| Averaging window | 50,000-100,000 |
50,000-100,000 |
| Hardware layout | 32 MPI ranks | 2 MPI ranks / 2 GPUs |
Scalar Checks
| Run | Final Divergence | Final KE | Bottom Wall Stress |
|---|---|---|---|
| CPU, 32 MPI | 0.2276639E-12 |
0.2311216E+03 |
0.1009177E+01 |
| GPU, 2 MPI / 2 GPU | 0.3354102E-06 |
0.2286064E+03 |
0.9768977E+00 |
These values are close enough for a turbulent long-run validation. The instantaneous trajectory is expected to decorrelate because small floating-point differences grow chaotically in turbulence.
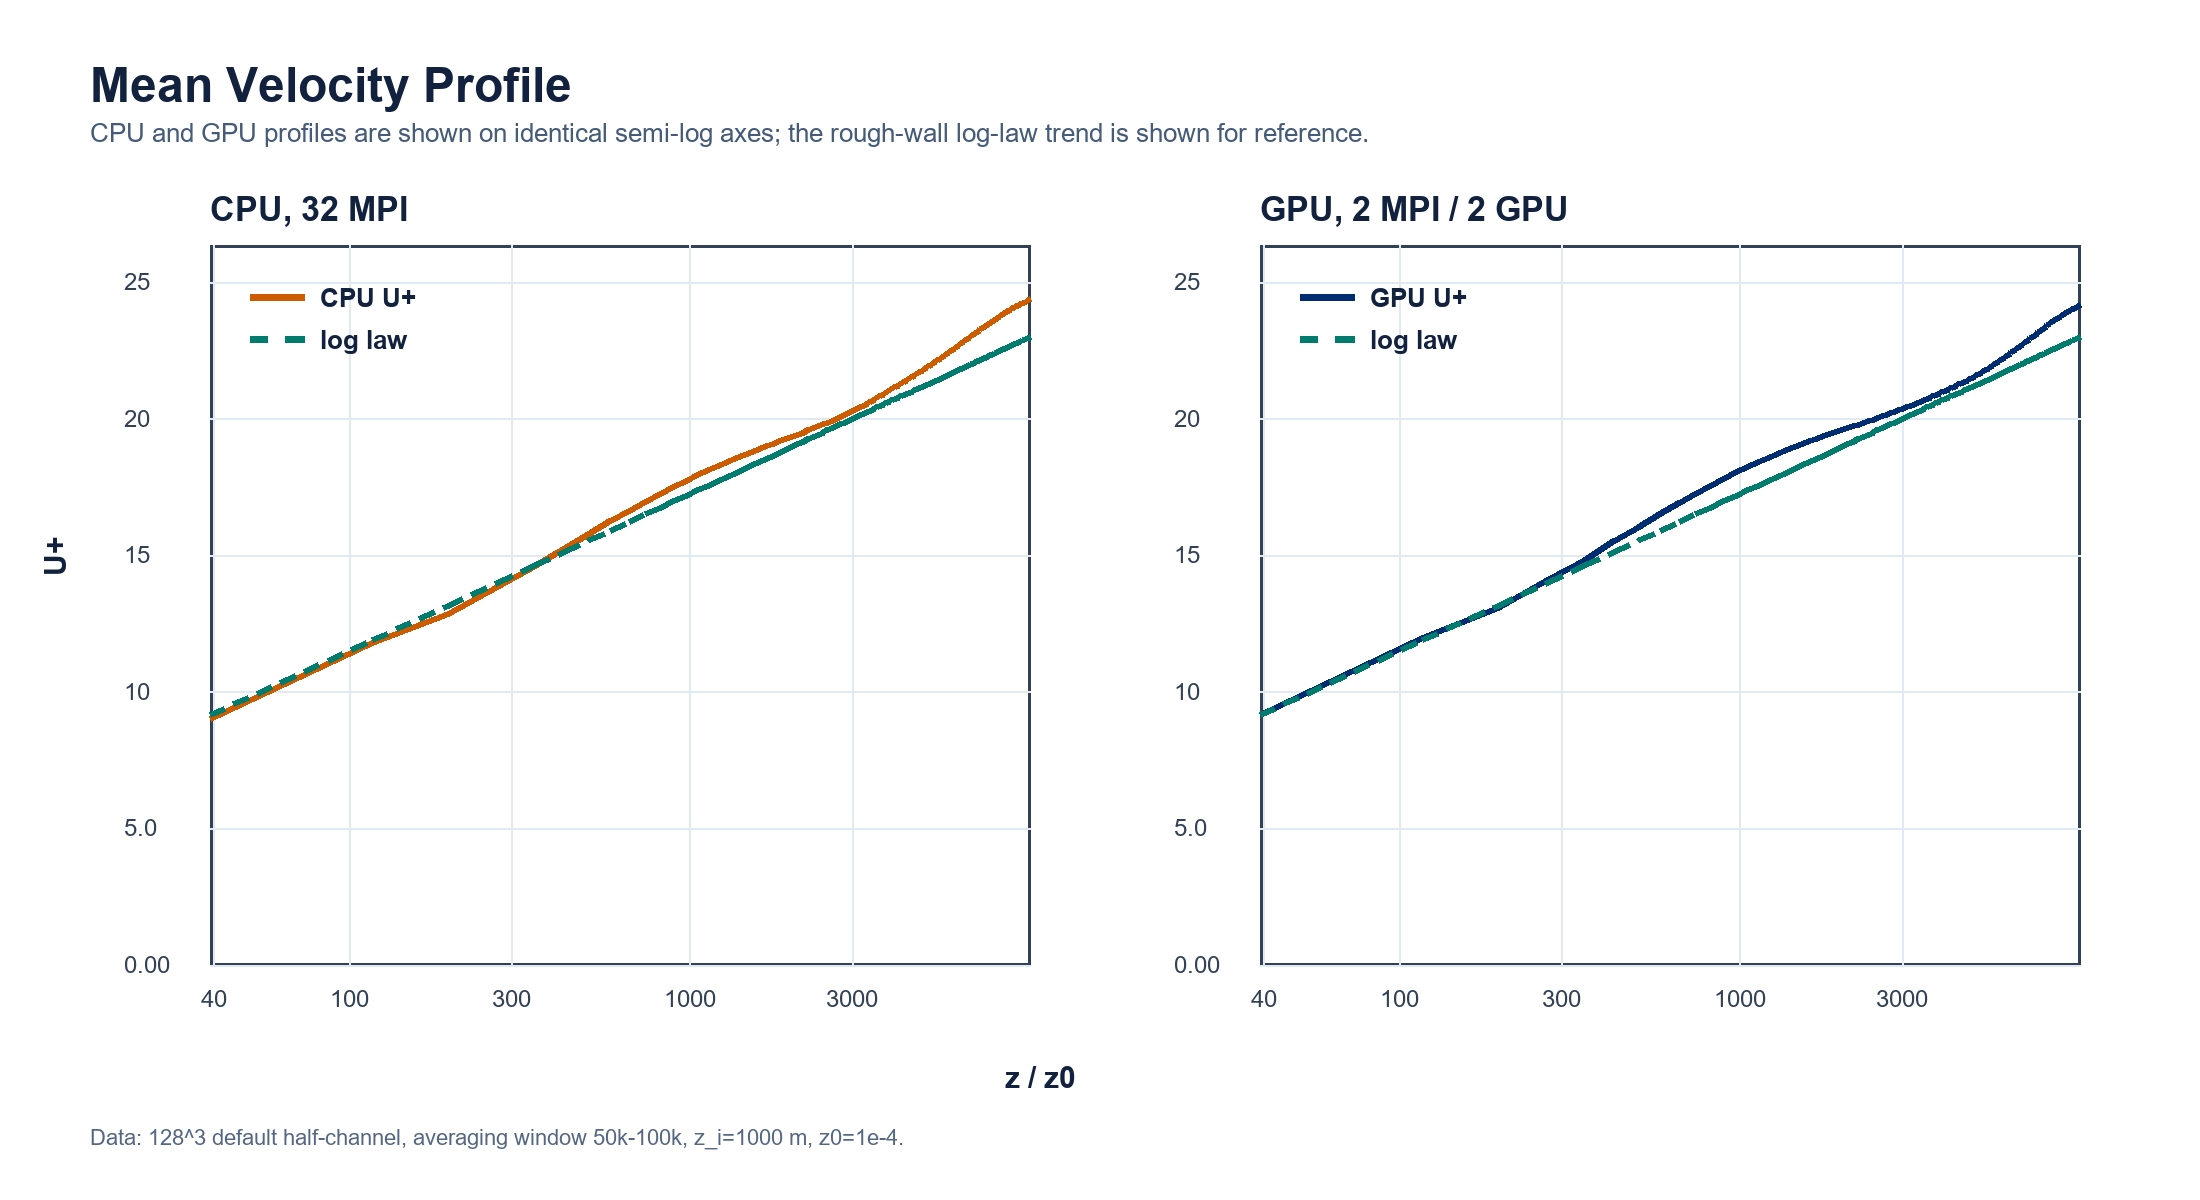
Mean Velocity
The mean velocity profile is compared against the rough-wall log-law trend. CPU and GPU are shown on identical semi-log axes, with wall distance z/z0 on the horizontal axis and U+ on the vertical axis.
| Metric | Value |
|---|---|
| Mean velocity L1 difference | 2.43078E-01 |
| Mean velocity relative L2 difference | 1.19896E-02 |
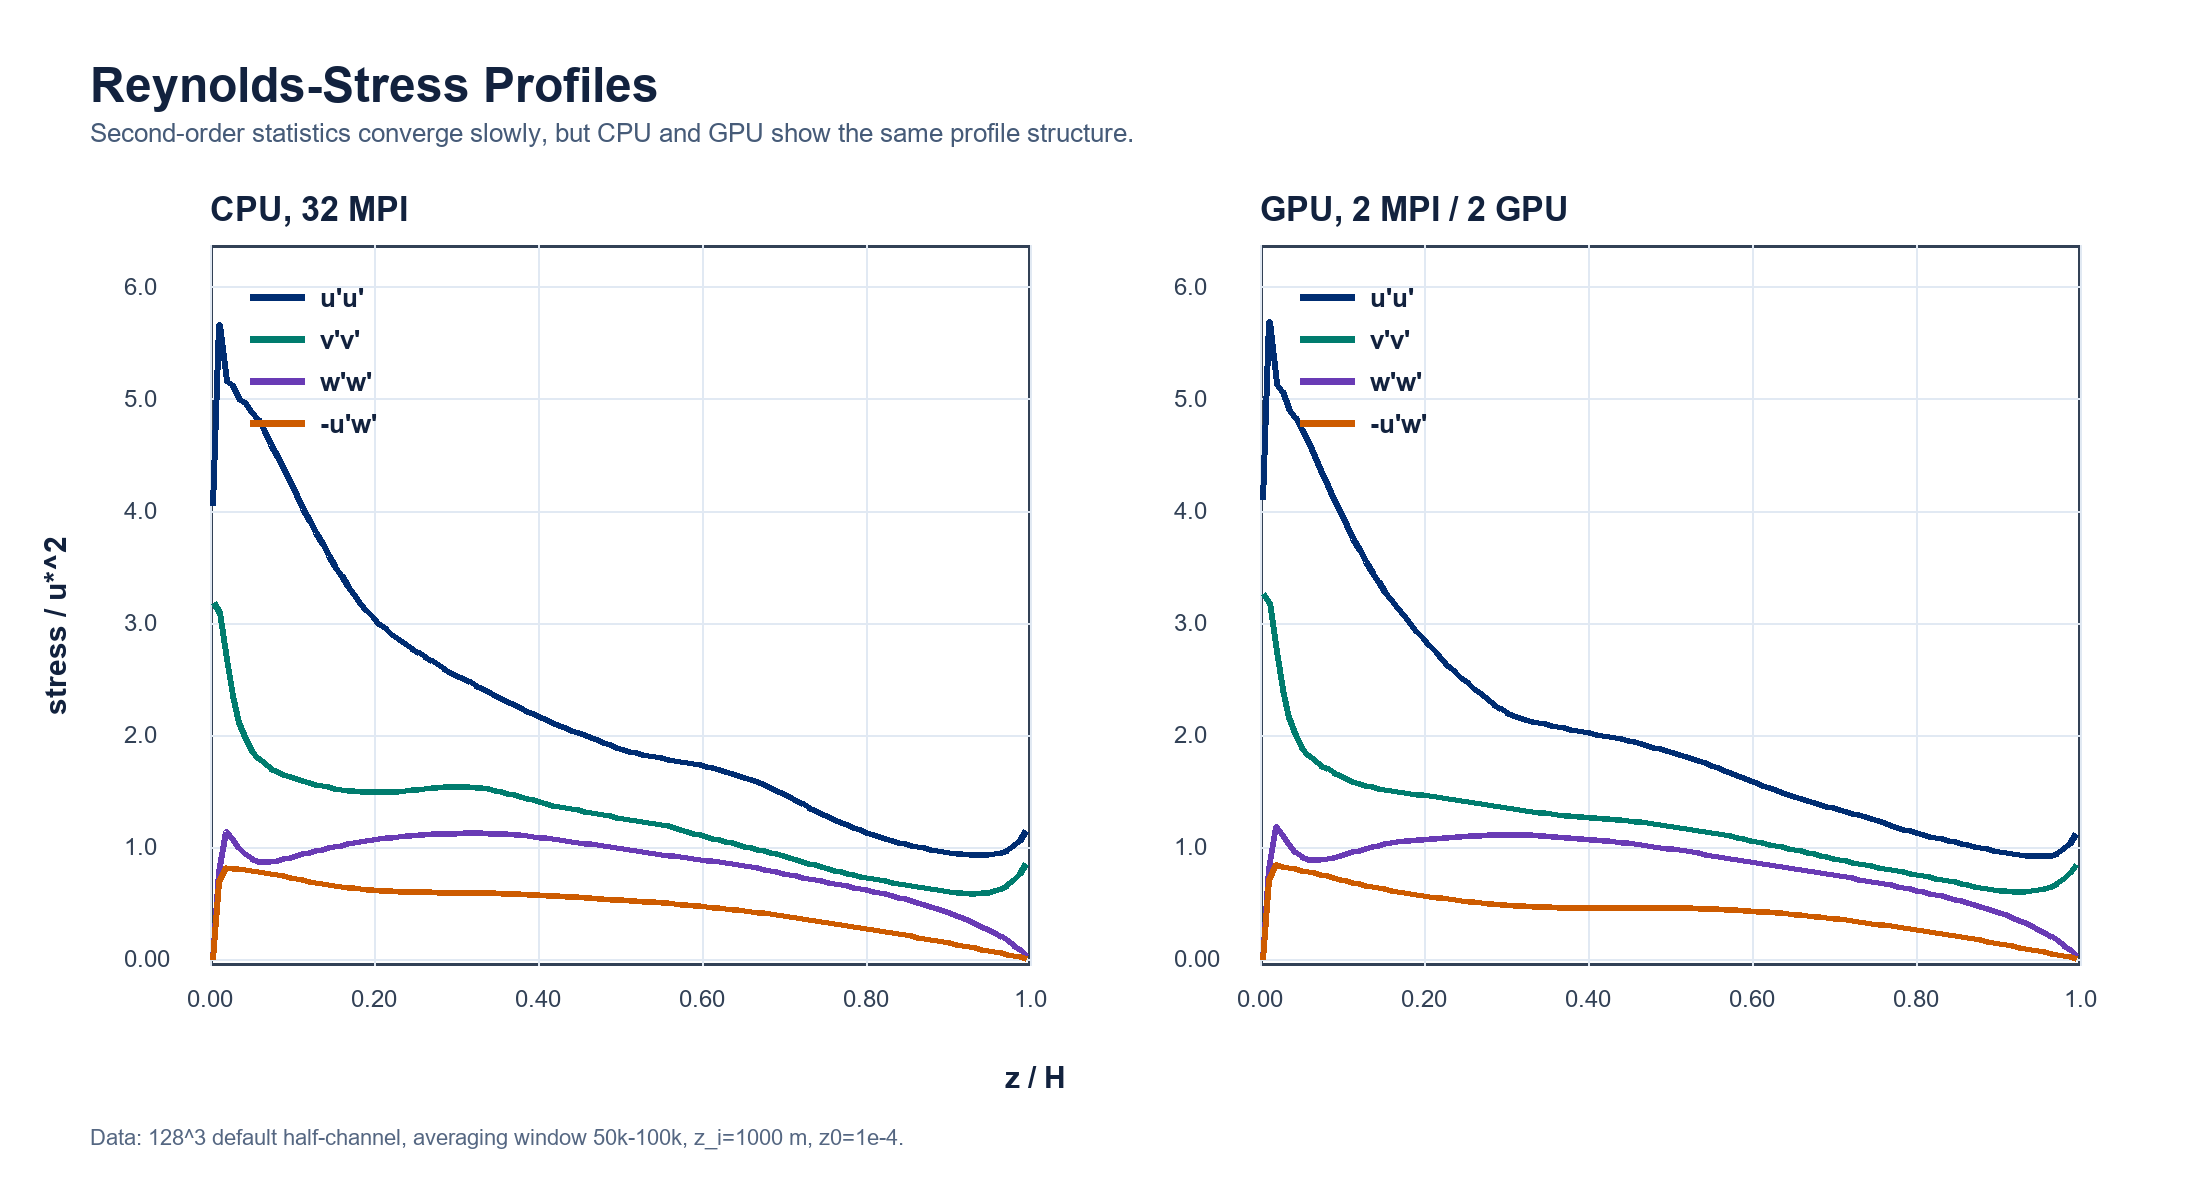
Reynolds Stresses
Second-order statistics converge more slowly than the mean profile. The CPU and GPU profiles are compared side by side over the 50,000-100,000 window; the component shapes and near-wall behavior remain consistent, while the remaining differences should be treated as finite-time turbulent sampling error rather than pointwise trajectory error.
| Metric | Value |
|---|---|
u'u' L1 difference |
1.27736E-01 |
u'u' relative L2 difference |
6.49681E-02 |
-u'w' L1 difference |
4.48119E-02 |
-u'w' relative L2 difference |
1.16428E-01 |
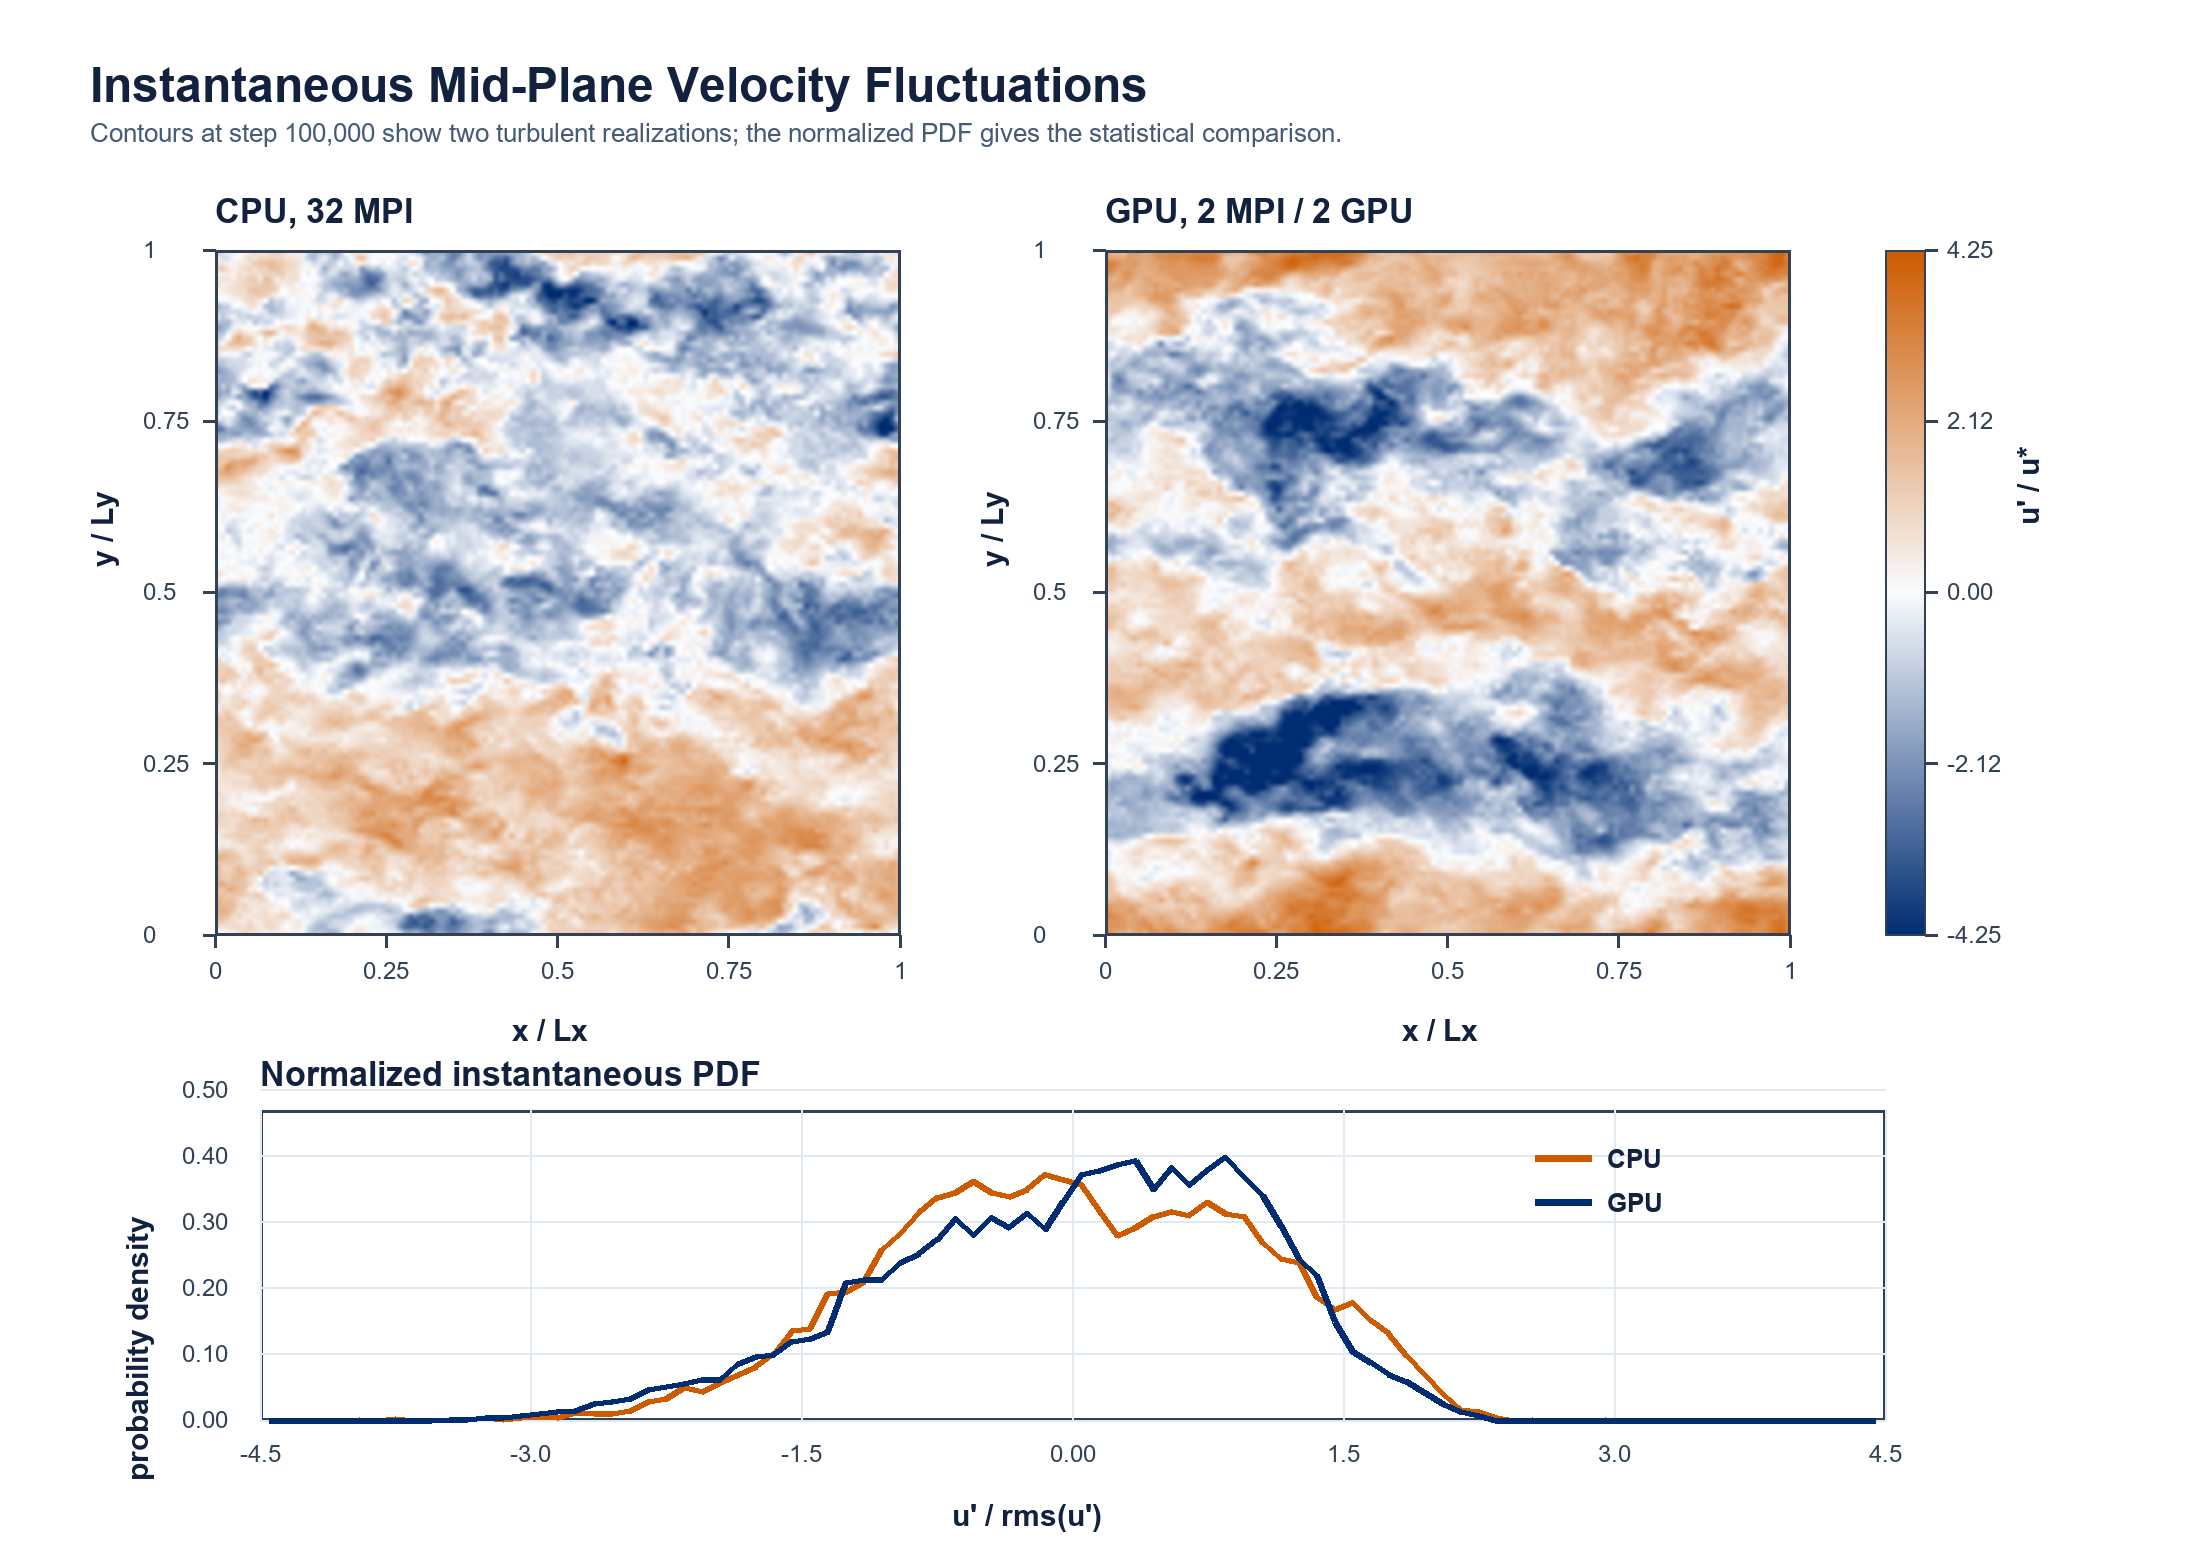
Instantaneous Z-Plane And PDF
The mid-plane contours compare the instantaneous u' field at z/H = 0.5 and step 100,000. These are not expected to match pointwise after a long chaotic turbulent integration. The contours are therefore used only to check that both runs show physically turbulent structures, while the normalized PDF compares the instantaneous fluctuation distribution more directly.
| Instantaneous metric | CPU | GPU |
|---|---|---|
u' RMS on z/H=0.5 plane |
1.33458 |
1.75819 |
| Normalized PDF skewness | -0.119722 |
-0.425260 |
| Normalized PDF kurtosis | 2.49917 |
2.70626 |
| Plane file | vel.z-0.50000.100000.c15.bin |
vel.z-0.50000.100000.c0.bin |
| PDF Agreement Metric | Value |
|---|---|
| L1 distance between normalized PDFs | 1.95679E-01 |
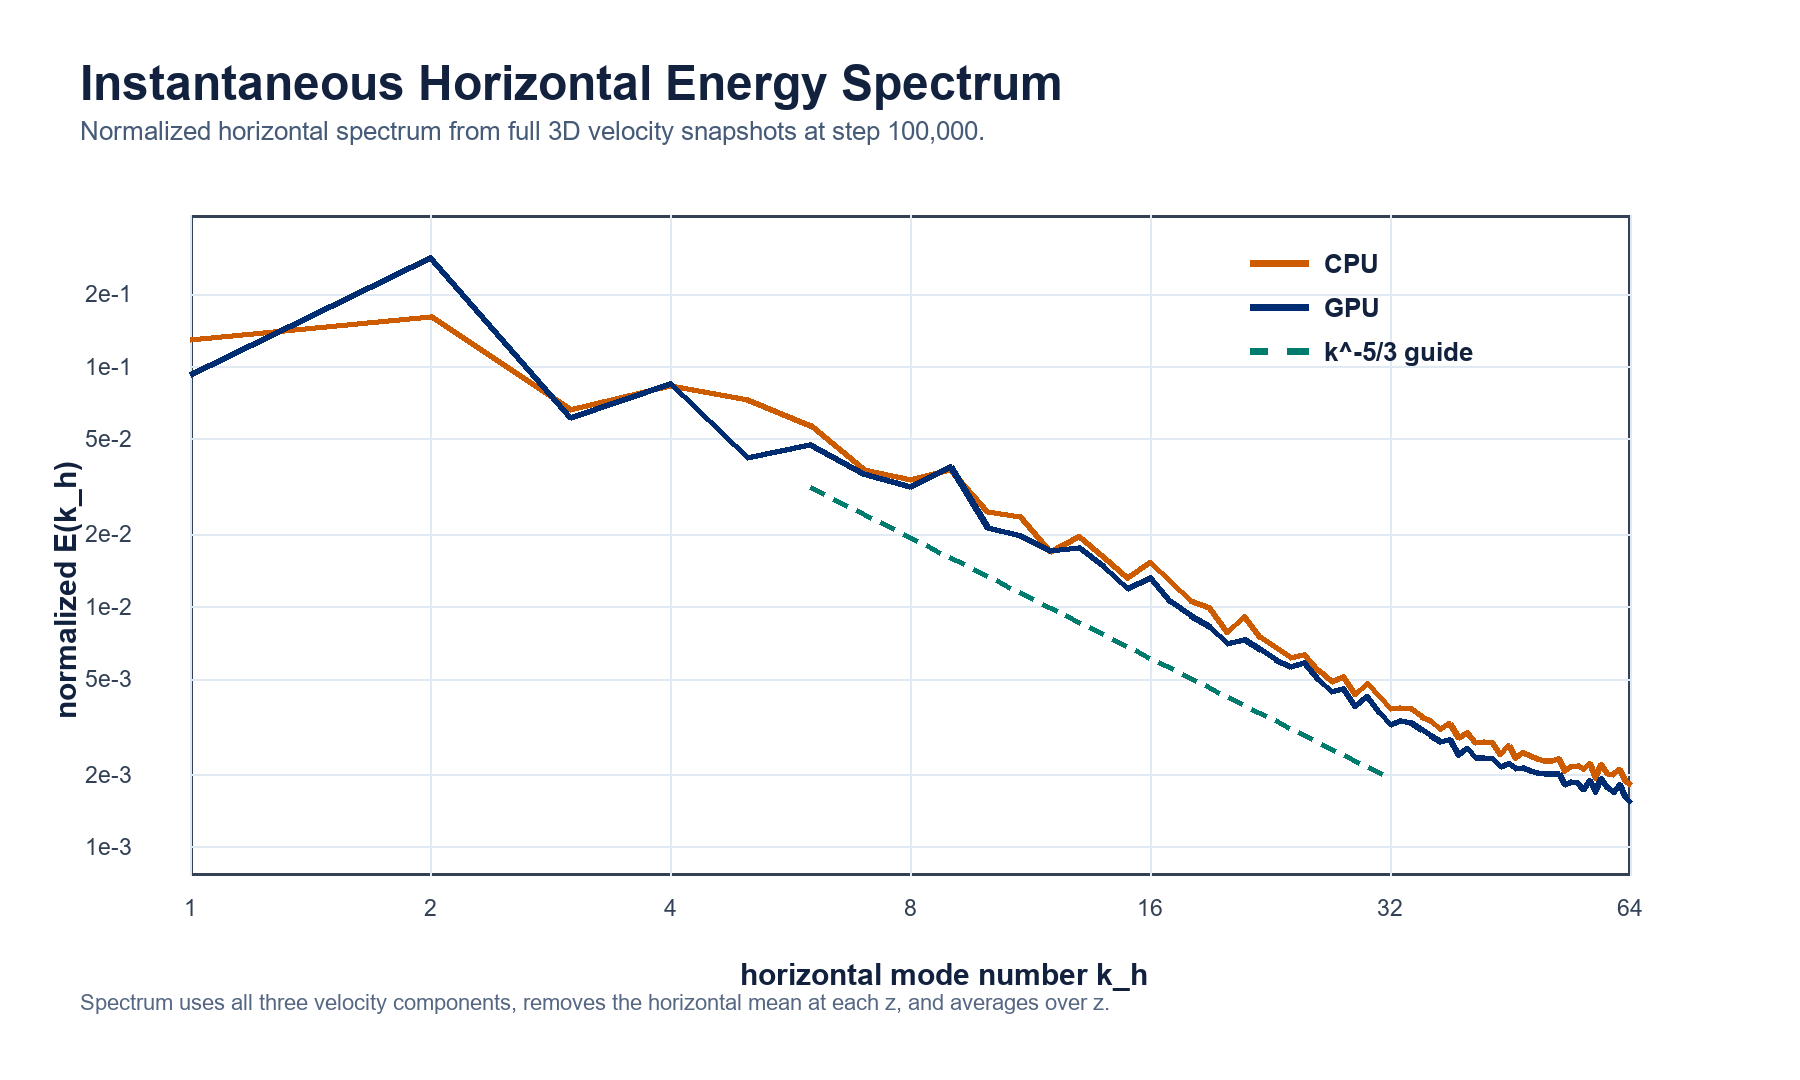
Horizontal Energy Spectrum
The spectrum below is computed from the full 3D instantaneous velocity snapshots at step 100,000. Because this is a wall-bounded channel, the transform is applied only in the periodic horizontal directions; the horizontal mean is removed at each height, all three velocity components are included, and the result is averaged over z.
| Spectrum Metric | Value |
|---|---|
| L1 distance between normalized horizontal spectra | 2.52855E-01 |
| Snapshot files | vel.100000.c*.bin |
Interpretation
The GPU result passes the current physical validation gate for this stage: the mean profile follows the expected log-law trend, the Reynolds-stress profiles have the correct structure, and the instantaneous mid-plane field shows developed turbulent streaks and patches rather than laminar behavior.
480x240x240 ATM Benchmark
This is the short no-I/O verification case for the actuator turbine model at 480 x 240 x 240. The comparison uses the same case setup and reports compute time only.
Test Setup
| Item | Setting |
|---|---|
| Case | test-cases/actuator_turbine_model |
| Grid | Nx=480, Ny=240, Nz=240 |
| Active module | USE_ATM=ON |
| Output policy | Heavy domain/plane output disabled for timing runs |
| CPU sweep | 24, 40, 60, 80, 120 MPI ranks; 3 steps |
| GPU timing | A100 runs, average of steps 2-10 |
| GPU configurations | 1 GPU / 1 MPI and 2 GPUs / 2 MPI measured on same-node A100 runs |
Runtime Summary
| Run | Step Time | Speedup vs Best CPU | Notes |
|---|---|---|---|
| Best CPU | 0.634 s/step |
1.0x |
120 MPI ranks |
| 1 GPU / 1 MPI | 0.103 s/step |
6.1x |
A100, optimized default path |
| 2 GPUs / 2 MPI | 0.061 s/step |
10.4x |
Same-node A100 run |


CPU Sweep
The CPU baseline is selected from this short rank sweep.

Module Breakdown

Flow-Field Verification
The figure compares the z=2.5 velocity plane at step 10. The left and center panels show the CPU and GPU u field; the right panel shows the absolute difference.

| Component | L1 Mean Error | L2 Error | Max Error |
|---|---|---|---|
u |
4.97E-16 |
6.60E-16 |
3.11E-15 |
v |
1.57E-16 |
2.06E-16 |
9.98E-16 |
w |
7.75E-17 |
1.02E-16 |
5.06E-16 |
Scalar Checks
| Run | Divergence | KE | Bot Wall Stress |
|---|---|---|---|
| CPU, 2 MPI, step 10 | 0.2681714E-03 |
0.4998491E+00 |
0.8686115E-05 |
| 1 GPU / 1 MPI, step 10 | 0.2681679E-03 |
0.4998491E+00 |
0.8686115E-05 |
| 2 GPUs / 2 MPI, step 10 | 0.2681714E-03 |
0.4998491E+00 |
0.8686115E-05 |
Reproduce
cd /glade/u/home/wchen/lesgo-gpu-test/test-cases/actuator_turbine_model
qsub job_compare_cpu120.pbs
qsub job_compare_gpu1_noio.pbs
qsub job_compare_gpu2_noio.pbs